
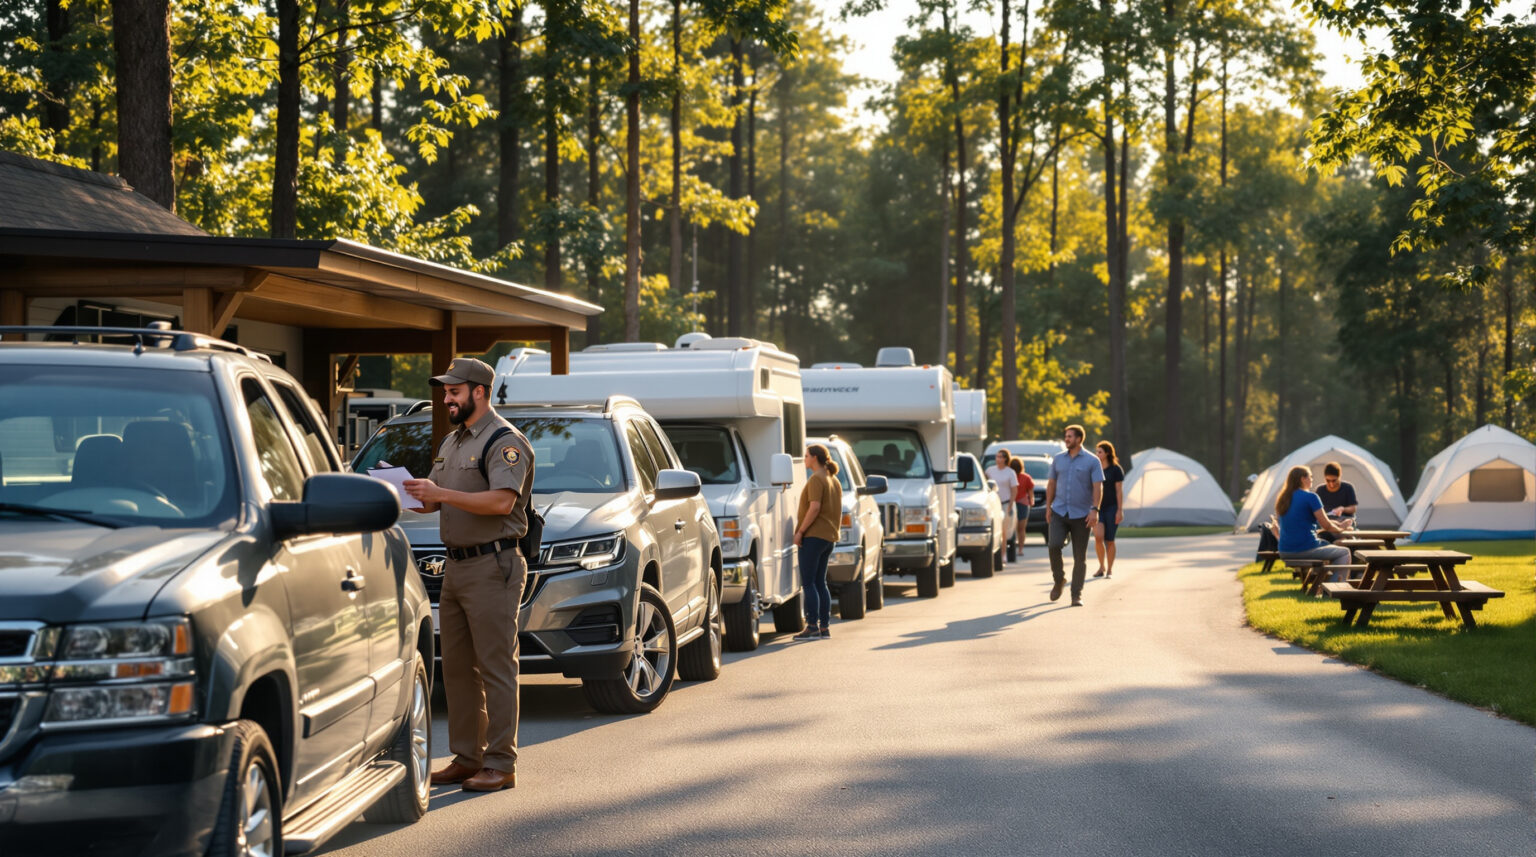
Last Memorial Day Friday, fourteen rigs were idling at your gate by 6:02 p.m., the golf-cart radios were crackling, and ‘check-in’ felt more like rush hour on the interstate. Sound familiar?
Digital arrivals already slash the paperwork—now imagine knowing precisely when that line will form so you can erase it before the first brake light appears.
What if a quick glance at your dashboard told you to double staff from 4:30 to 5:15, fire up the kiosks at 5:16, and push a mobile check-in text at 3:00—turning a twelve-minute slog into a two-minute wave?
Keep reading to see how reservation data, local-event calendars, and a sprinkle of A.I. can turn your front desk into a friction-free, revenue-boosting machine.
Key Takeaways
– Digital check-ins cut paperwork, but Friday rushes can still create long lines
– Use past arrival times, local events, weather, and social media chatter to predict exactly when crowds will come
– Schedule extra staff, power up kiosks, and send mobile check-in texts right before those peak minutes to shrink waits from 12 to 2 minutes
– Keep backup internet and small battery packs so kiosks keep working if Wi-Fi or power fails
– Protect guest data with secure payment tools, role-based access, and clear privacy notices
– Check four simple numbers each week—average check-in time, longest line, labor hours per 100 arrivals, and guest satisfaction—to spot and fix problems fast
– Parks that follow this plan can serve up to three times more guests with the same team and boost visitor happiness.
Digital Arrivals Are Great—Prediction Makes Them Powerful
Campgrounds have sprinted from clipboards to cloud apps in just a few seasons. Digital-check-in adoption leaped 340 percent between 2020 and 2023, rising from 12 percent of U.S. parks to 67 percent, and analysts expect 85 percent by year-end 2024 (industry analysis). Average counter time has fallen to about three minutes, freeing teams to greet more guests with fewer keystrokes.
Yet lines still snake out the door on Fridays. Delaware North discovered this first-hand at Yavapai Lodge, where self-service kiosks trimmed transactions but couldn’t calm every surge until staffing matched the spikes. Once managers paired kiosks with targeted scheduling, lobby congestion melted away (lodge case study). The lesson is clear: digitize the task, yes—but forecast the rush if you truly want to eliminate it.
Turning Reservation Logs Into Crystal Ball
Your property-management system is already a goldmine. Pull two years of arrival timestamps and chart guests per 15-minute block. Holiday eves and the first two hours after sunset nearly always glow red on the heat map, giving you an evidence-based starting point for staffing templates.
Next, mark the days when the line felt unmanageable. Ask the team what else was happening—live music on the lake, a regional baseball tournament, or a heavy-traffic weather window. These narrative notes convert raw numbers into context, the same context a machine-learning model would use. Before long you have a baseline KPI set: arrivals per 15-minute interval, average front-desk time, and queue length at peak. Establishing these metrics first ensures that any fancy algorithm actually moves the needle, not just the hype.
Layering Weather, Events, and Social Chatter
Researchers recently showed that an event-aware model blending reservation data with public calendars and sentiment analysis can predict visitor spikes with more than 85 percent accuracy (ML study). You don’t need a Ph.D. to imitate the approach. Subscribe to county-fair feeds, scrape school-break schedules, and set a free weather alert that pings whenever rain odds drop below ten percent on a weekend. Each signal nudges your forecast toward airline-level precision.
Social media offers an early-warning layer. A sudden flurry of “See you at #LakeFest” posts can precede a wave of late bookings by up to 48 hours. Tag these spikes in your model so the system learns to expect an extra dozen rigs the next time the festival returns. Feed the anomalies back into your spreadsheet—or API if you run multiple parks—and watch prediction error shrink week by week. Now that you know exactly when the swell hits, here’s how to put boots and bots in position.
Deploying Staff, Kiosks, and Mobile Links at Exactly the Right Moment
Accuracy is useless without action. Once the dashboard predicts a queue longer than six parties for more than 30 minutes, trigger a text to management and let your campground staff scheduling software slot an additional host. Shifting labor to 30-minute windows typically trims payroll 10–15 percent while occupancy climbs because you’re placing people where the work is, not where you remember the work used to be.
Technology should follow the same just-in-time logic. Power up kiosks an hour before the model expects a spike; keeping them dark during lulls extends screen life and reins in utility bills. Meanwhile, send a mobile-check-in link three hours before the rush and dangle a tangible perk—a free s’mores kit or advance site selection—for parties that finish the form. Greeters at the gate can then ask, “Have you completed mobile check-in? It takes under a minute and jumps you ahead of the line,” redirecting traffic before wheels ever stop rolling.
Keeping Lines Moving When the Wi-Fi Doesn’t
Forecasts crumble if connectivity falters the moment everyone shows up. Rural properties hedge their bets with a cellular hotspot, Starlink dish, or point-to-point wireless backup that auto-fails over when the primary ISP dips. Pair each kiosk or tablet with its own uninterruptible power supply; a five-minute battery bridge keeps arrivals flowing through brief brownouts.
Offline-mode caching in most modern PMS platforms captures signatures and payments locally, syncing the data once the signal returns. Protective enclosures, glare-resistant screens, and scheduled after-hours software updates round out a resilient hardware plan. They ensure a Friday thunderstorm—or even a brief outage—can’t derail your predictive arrival analytics.
Protecting Guest Data While You Crunch the Numbers
A bigger data pool means greater responsibility. Keep all card handling inside PCI-compliant gateways and enable automatic purging of ID scans after verification so sensitive images never linger on local devices. Restrict dashboard access by role; seasonal hires don’t need export privileges.
Post a concise privacy notice at kiosks and in confirmation emails explaining what information you collect and why. Transparency boosts guest confidence in digital tools, which in turn raises adoption rates and shortens lines. Quarterly password audits and mandatory two-factor authentication for anyone with system-admin rights close the loop on security basics.
Measure, Tweak, Repeat: Building a Culture of Continuous Improvement
Treat your prediction model like a living asset. Review four core KPIs—average check-in time, queue length at top three peaks, labor hours per 100 arrivals, and NPS for the arrival experience—every week during high season. A five-minute huddle is usually enough to spot drift and recalibrate staffing or text timing.
Run micro A/B tests to keep learning. One weekend send the mobile link 48 hours out, the next weekend six hours out, and compare completion rates. Feed unexpected events—wildfire smoke, a new music festival, or a highway closure—into the dataset so the algorithm adapts. Once you consistently process guests in under three minutes, redirect the same data-driven lens to propane refills, amenity rentals, or late-checkout payments.
Ready, Set, Forecast: A Quick-Start Checklist
Export the last 24 months of arrival timestamps and flag the ten worst queue days. Overlay regional event calendars and five-day NOAA weather forecasts to uncover patterns. Choose a forecasting tool—spreadsheet, PMS plug-in, or AI dashboard—and invite frontline employees to the demo so they can flag workflow snags early.
Draft a simple SOP for peak-day operations: who powers up kiosks, who monitors mobile-check-in completions, and who greets overflow vehicles outside. Finally, set calendar reminders to review KPIs every Monday morning. A quarter-hour of disciplined analysis beats an hour of angry horns on Friday night.
Friday traffic jams belong on the highway, not at your gate. When you can predict the spike, you can rewrite the guest’s first impression—and your bottom line—in real time. If you’re ready to turn raw reservation logs into a crystal-clear staffing playbook, automate the mobile nudges that thin the queue, and fold those insights into every other touchpoint from pre-trip ads to post-stay loyalty offers, let’s talk. Insider Perks pairs outdoor-hospitality know-how with marketing, AI, and automation muscle so you can see the line before it forms—then watch it disappear. Grab a quick call and we’ll show you what a forecast-powered, friction-free arrival looks like for your park next Friday.
Frequently Asked Questions
Q: I only run a 60-site park—do I really have enough data to forecast peaks accurately?
A: Yes; even a single season provides hundreds of arrival timestamps, which is more than enough to spot repeating patterns such as Friday-evening surges or holiday bumps. Small datasets can be smoothed with simple moving averages or free spreadsheet add-ins, and you can refine the model as new seasons add volume.
Q: What’s the quickest way to pull arrival timestamps from my PMS?
A: Most cloud PMS platforms let you export reservations as a CSV; choose fields that include scheduled arrival date and actual check-in time, then sort or pivot by 15-minute intervals in Excel or Google Sheets to build your first heat map in under an hour.
Q: We still accept a lot of walk-ins—can a forecast handle unpredictable traffic?
A: Walk-ins tend to correlate with the same external signals—good weather, local events, or school breaks—so including those factors in your model lets you anticipate a combined walk-in and reservation rush even when the exact parties aren’t on the books.
Q: How much staff scheduling flexibility do I need to make this worthwhile?
A: Shifting just one team member for two peak windows per week typically offsets the extra hours by reducing idle time during lulls, so even parks with fixed full-time rosters can reassign duties like grounds or retail coverage to match the forecast without expanding payroll.
Q: Will adding kiosks or mobile links confuse tech-shy guests?
A: Adoption rises when you frame the tools as optional “skip-the-line” perks; signage that says “Check in here in under a minute” and staff who can do the first screen with the guest quickly turn skepticism into relief rather than frustration.
Q: Can I accomplish this without hiring a data scientist or buying an AI subscription?
A: Start with a spreadsheet or the basic analytics built into many PMS systems; once you prove the ROI, you can layer on inexpensive AI dashboards or free machine-learning templates that require minimal technical know-how.
Q: How accurate should my predictions be before I change staffing levels?
A: Aim for forecasting peak intervals within a 30-minute window at least 70 percent of the time; that threshold is usually enough to shrink lines noticeably and justify schedule tweaks, and you can fine-tune from there.
Q: What about guest data privacy when I’m merging multiple data sources?
A: Keep personally identifiable information inside the PMS and only export anonymized fields like arrival time, party size, and site type; external tools should see no names, emails, or payment data, maintaining PCI and privacy compliance.
Q: How do I safeguard check-in tech against spotty rural internet?
A: Equip kiosks and tablets with offline-mode caching and a cellular or Starlink backup so arrivals are stored locally during outages and sync automatically once connectivity returns, preventing lost transactions or duplicate entries.
Q: My team worries that automation will cut hours—how do I get buy-in?
A: Frame prediction as a way to swap idle mid-afternoon minutes for productive peak coverage, not as a head-count reduction; staff usually appreciate finishing shifts earlier, earning tips on smooth arrivals, and avoiding angry lines.
Q: How soon should I see a return on investing time in forecasting?
A: Most properties report shorter queues and a measurable uptick in guest satisfaction within two to three busy weekends, while labor savings or upsell gains typically recoup any software costs within one peak season.
Q: Do I need to adjust forecasts for different accommodation types like cabins versus RV sites?
A: Yes; arrival timing often varies—glamping guests may reach the property later than RV travelers—so tagging each reservation by accommodation type lets you build more precise staffing cues for each guest segment.
Q: How do I factor late check-outs or early arrivals into the model?
A: Treat deviations as separate data points; logging when early birds actually appear or late leavers depart helps the algorithm learn real-world patterns rather than relying solely on stated reservation times.
Q: What KPIs should I monitor to keep the system improving?
A: Track average check-in duration, maximum queue length, labor hours per 100 arrivals, and post-stay feedback on arrival experience; reviewing these weekly highlights drift quickly and guides small, continuous adjustments.
Q: If I operate multiple parks, can one model work for all of them?
A: Use a shared framework but train individual models per location; regional weather, event calendars, and guest demographics differ enough that park-specific tuning delivers far better accuracy than a one-size-fits-all forecast.