
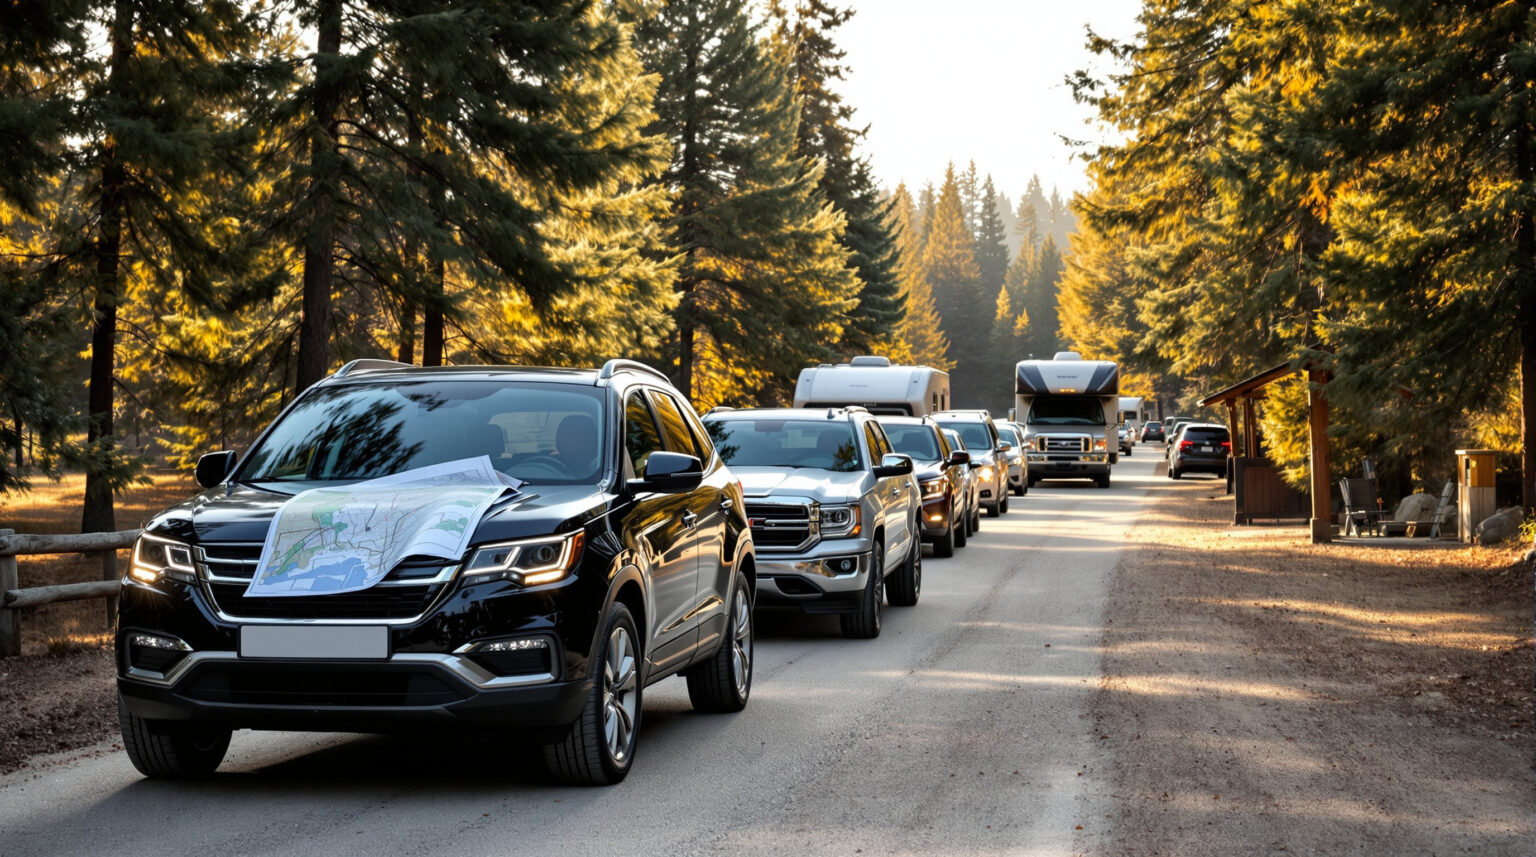
It’s 4:57 p.m. on a sold-out Friday. A row of 45-foot diesel pushers snakes past your entrance, the golf-cart shuttle is stuck behind a fifth-wheel that’s missed the loop turn, and your staff radios crackle with the same question: “Where do we put the next one?”
What if you could fast-forward this traffic jam on your laptop—swap in a one-way loop, stagger arrivals, or open a pop-up lane—then hit “undo” until the congestion disappears? Agent-based modeling turns every rig, car, and glamping guest into a testable digital twin, giving you a zero-risk sandbox for fixes that save minutes at check-in and miles of guest frustration.
Ready to see how a few lines of code can out-perform a dozen traffic cones? Keep reading.
Key Takeaways
- Big traffic jams hit the park around 4–6 p.m. on Fridays.
- Agent-based modeling (ABM) makes a computer “copy” of every road, RV, car, and person.
- You can try new traffic ideas on the screen first—no real risk, no angry guests.
- One park tested ABM, used staggered times and an extra lane, and cut the longest line by 40%.
- Build a model in three steps: collect gate and road data, draw the map in software, add move-and-stop rules for each vehicle.
- Fast fixes to test: early-bird arrival slots, a one-way loop, or a cone-made third lane.
- Run small pilots, watch what really happens, and adjust both the model and staff instructions.
- Shorter waits save labor, cut fuel, and raise guest ratings and repeat bookings.
- Free or low-cost tools like AnyLogic Cloud and Mesa help you start without a Ph.D..
Opening Snapshot: The 4-P.M. Check-In Crunch
Friday peaks are brutal because arrivals cluster inside the same two-hour window. Forty units may technically be “in process,” yet only two gate lanes and one overworked attendant stand between them and their sites. Those piling minutes translate into frayed tempers, idling diesels, and secondary backups that block store parking or shuttle routes.
Down the highway, a comparable park ran the same demand through a digital twin first. By testing staggered arrival windows and a temporary third lane, its agent-based model predicted a 40-percent drop in maximum queue length. After a low-cost pilot using cones and sandwich boards, the reduction held in the real world—proof that simulation can protect ratings, safety margins, and souvenir-shop revenue without major capital outlays.
What Agent-Based Modeling Really Means for Outdoor Hospitality
In plain language, an agent-based model (ABM) treats each vehicle, bicycle, or pedestrian as an independent “agent” that follows rules on a virtual map of your park. Unlike spreadsheet averages, these agents accelerate, yield, or circle when they miss a turn—exactly what guests do on a hectic Friday. That granular behavior lets you run unlimited what-ifs without closing a single loop road.
Recent advances make the approach even more compelling. A LLM study showed that large language models could supply agents with realistic, adaptive decision-making, producing traffic patterns that matched real highways with striking fidelity. If an AI can forecast a commuter’s detour, it can certainly guess how a Class A driver reacts to a flashing “Dump Station Full” message and reroutes to an overflow lane.
From Spreadsheets to Digital Campers: Building Your Model
First, strengthen your data foundation. Merge reservation time stamps, gate-keypad logs, license-plate camera hits, and handheld-tablet check-ins into a single arrival file. For one or two peak weeks per season, lay inexpensive road-tube counters at choke points to capture flow curves; those extra data points inject realism that no guesswork can match. Drop everything into a cloud folder with a living data dictionary so consultants, managers, and modelers work from the same sheet. Consistency matters more than millisecond precision.
Next, sketch the park as a graph. In AnyLogic, Mesa, or similar tools, every driveway segment becomes an edge and each intersection a node. The method mirrors a 2024 dynamic-layout experiment that slashed cruising time up to 46 percent by auto-testing alternative geometries. When roads, dump stations, and back-ins live in code, you can extend a lane with two clicks or flip an arrow to one-way without renting a striping machine.
Finally, teach agents to think. Layer car-following logic for braking distances, add yield rules at blind curves, and plug in AI routines that let them alter routes when LED boards warn of a backup. A tourism paper found that more than half of travelers changed plans when congestion alerts hit their phones, so your virtual campers should be just as fickle.
A Six-Step Roadmap from Blank Screen to Ground Truth
Creating a digital twin is less daunting when you break it into predictable phases. Each step builds on the last, letting you capture quick wins early while still marching toward a fully validated model. Think of it as a construction schedule for code: foundation first, finishes last, inspections throughout.
1. Name pain points—gate queues, dump-station lines, holiday exit surges, or wildfire evacuation paths.
2. Build a baseline model and calibrate until simulated counts sit within 10 percent of last season’s numbers.
3. Layer real-time intelligence like text alerts or dynamic lane assignments.
4. Experiment with policies—staggered arrivals, one-way loops, or pop-up lanes—and track KPIs such as average wait and idling CO₂ minutes.
5. Validate against fresh sensor data and adjust friction factors until error falls below 5 percent.
6. Refresh datasets annually as rig sizes, guest demographics, and event calendars evolve.
Once the six steps cycle through, you have more than a one-off project; you have a living operational asset. Managers can duplicate the model for special events, storm evacuations, or shoulder-season promos, shortening decision time from weeks to hours. The result is a culture that expects data to guide layout tweaks instead of gut feelings.
High-Impact Scenarios to Test First
Not all experiments deliver equal payoff. Early runs should target the bottlenecks guests feel most, because visible wins buy staff and owner buy-in for deeper changes. The following three ideas routinely surface as low-cost, high-return plays.
• Staggered arrivals: shifting just 30 percent of rigs to pre-3 p.m. slots can slice peak wait from 20 to 6 minutes.
• Temporary one-way loop: eliminating forced left turns cut cruising miles by 30 percent in simulation.
• Cone-made third lane: modeling pinpoints the occupancy threshold where the extra staffer pays for itself in satisfaction and store sales.
After the initial trio, branch into subtler tweaks like dump-station sequencing or dynamic signage near playground crossings. Each simulation takes minutes to run, so you can iterate a dozen concepts in the time it would take to place real cones once. Momentum grows when the team sees concrete numbers instead of hopeful guesses.
Rolling Changes from Screen to Pavement
Pilot on a shoulder-season weekend before painting lines. Use cones, sandwich boards, and magnetic signs so you can revert fast if flows shift. Assign a roaming staffer with a radio to log micro-behaviors the model missed, then feed those insights back into the simulation before making anything permanent.
Successful pilots deserve robust documentation. Capture photos, lane-timer screenshots, and staff debrief notes in a shared folder, because visual evidence helps reluctant stakeholders accept the new normal. Most parks repeat this field-validation ritual twice before locking in signage or asphalt.
Train Staff to Own the New Flow
Hold a short classroom session on the “why,” hand out lanyard maps, and run a 30-minute drive-through rehearsal. Make the training interactive by asking attendants to predict what happens if a 45-footer misses a turn, then reveal the simulation’s answer. Engagement rises when people see their own decisions mirrored on-screen.
Empower front-line teams to override rules for oversize rigs or medical emergencies—flexibility keeps queues from freezing. Encourage them to radio real-time quirks, like a dog show in the field that attracts extra cars, so the model can learn those fringe cases. When staff watch the digital twin adapt, they become champions rather than skeptics.
Keep Guests in the Loop
Collect preferred contact methods, text staggered-arrival reminders two hours out, and post a low-cost LED board that flips between welcome text and real-time lane assignments. Clear, consistent messaging lowers anxiety and nudges behavior without heavy enforcement. Guests that glide through the gate arrive in a better mood—and tend to spend more.
After checkout, send a one-question survey on ease of navigation and fold replies into the next calibration cycle. Publish summary stats in your newsletter to show transparency and celebrate improvements. Social proof turns satisfied travelers into unpaid ambassadors who brag about “the park that runs like an airport.”
Safety and Sustainability: Non-Negotiables
Reserve an unobstructed lane per loop for EMS and wildfire exits, mark crossings near playgrounds with solar flashers, and add five-minute pull-off zones so late arrivals can study maps without idling in the main flow. Safety layers must stay visible in every scenario so efficiency never compromises emergency readiness.
Sustainability matters, too. The CO₂ research shows idling diesels emit disproportionate pollutants during stop-and-go patterns, exactly what long queues create. Trim wait time and you cut emissions, reinforce your eco-brand, and position the park for future green-certification perks.
Show Me the Money: Measuring ROI
Trim check-in by four minutes per rig and two attendants reclaim hours each weekend to upsell or escort VIPs. Lower idling diesel costs, raise online ratings, and watch repeat bookings stack up—often enough to pay back software and training in a single peak season. Demonstrating hard dollars, not just smoother driveways, keeps budgets flowing for next-level tech like RFID passes.
Track savings with a simple ledger: labor hours avoided, gallons of fuel spared, and uplift in ancillary spend. Attribute each win back to the simulation step that enabled it so future experiments have a financial roadmap. Over time, the model becomes as important a ledger entry as any physical asset on the balance sheet.
Quick-Start Toolkit
Drag-and-drop in AnyLogic Cloud, prototype in Mesa if you’re Python-savvy, or borrow open-source road graphs from industry forums. Even a coarse model surfaces bottlenecks intuition misses, and you can refine as data flows in.
Start small: map just the entrance and main loop, run one Friday, and test two policies. A weekend of tinkering often reveals actionable insights that make Monday’s staff meeting electric with possibilities. Iterate, enlarge the map, and you’ll soon wonder how you ever planned traffic without a living crystal ball.
Every minute your guests aren’t idling at the gate is a minute they’re falling in love with your park—and talking about it online. If you’re ready to turn digital twins, automated arrival texts, and data-driven signage into higher ratings and fuller shoulder seasons, Insider Perks is ready to co-pilot. Our blend of outdoor-hospitality expertise, AI, marketing, advertising, and automation can take your fresh traffic insights and weave them into end-to-end guest journeys that sell themselves. Let’s model the possibilities together—schedule a quick call and see how smoothly your next Friday can run.
Frequently Asked Questions
Q: Do I need an in-house data scientist to build an agent-based model for my park?
A: No. Many parks start with drag-and-drop cloud tools or hire a consultant for the first prototype, then hand maintenance to a tech-savvy manager; the learning curve is closer to spreadsheet macros than computer science grad school, and most operators are running useful simulations after a weekend of guided setup.
Q: What kind of data do I actually have to collect before I can run a realistic model?
A: A single season’s reservation timestamps, gate or keypad logs, a rough site map, and a few days of simple road-tube counts at chokepoints are usually enough; perfection is less important than consistency, because the model can be calibrated to match observed averages within a small margin of error.
Q: How much does the software cost?
A: Entry-level cloud licenses for packages like AnyLogic or Simio start around a few hundred dollars per year, while fully open-source options such as Mesa in Python are free but may require more DIY effort; most parks recover software costs with a single season of labor and fuel savings.
Q: My campground is only 80 sites—will the benefits justify the effort?
A: Smaller properties often see proportionally bigger wins because one stalled rig can gridlock the entire entrance; even trimming average check-in by three minutes frees staff to upsell, reduces online complaints, and smooths Friday chaos that turns first impressions sour.
Q: How long does it take to build and validate the first usable model?
A: Expect a focused two- to four-week sprint: one week to gather data and draw the road graph, one week to calibrate against last season’s counts, and another week or two to test scenarios and fine-tune, with most of that time happening after hours so daily operations stay untouched.
Q: What if guest behavior changes after I implement a new traffic pattern?
A: The model is meant to be a living tool—feed fresh sensor counts or staff observations back in every few months, rerun calibration, and the simulation will adapt to new rig sizes, guest demographics, or special-event loads much faster than static paper plans.
Q: Are there privacy or security concerns with using license-plate or camera data in the model?
A: You only need anonymized time stamps and class sizes, not personal identifiers; strip or hash plate numbers before import, store files in the same secure folders you already use for reservations, and you’ll stay well inside typical data-privacy guidelines.
Q: Can the model handle mixed traffic like golf carts, bikes, and pedestrians?
A: Yes; each mode can be its own agent class with different speeds, widths, and right-of-way rules, allowing you to test how shuttle routes or new bike paths affect both safety and vehicle queues within the same simulation.
Q: How accurate are these simulations compared to real-world results?
A: When calibrated with even modest sensor data, agent-based models regularly hit within five to ten percent of observed wait times and queue lengths, enough precision to rank alternative layouts and policies with confidence before you spend on pavement or payroll.
Q: What hardware do I need on the ground to run pilots based on the model’s recommendations?
A: Most trials rely on traffic cones, sandwich boards, magnetic signs, and a roaming staffer with a radio; optional extras like low-cost LED boards or portable license-plate cameras refine data but aren’t mandatory for a credible pilot.
Q: How do I get guests to follow staggered arrival windows predicted to relieve congestion?
A: Incentives such as early-bird store coupons, free firewood bundles, or preferred-site upgrade drawings, combined with automated text reminders and a clear map link two hours before arrival, typically push 25–40 percent of guests into off-peak slots.
Q: What’s the typical ROI timeline for a midsize RV resort?
A: Parks report recouping software and staff training costs in one peak season through reduced overtime, lower fuel burn from idling, and uplift in satisfaction scores that drive repeat bookings and ancillary spend.
Q: Could bad weather or a special event invalidate the model’s recommendations?
A: Extreme conditions can alter volumes, but you can clone the baseline model, dial up arrival rates or slow speeds to simulate rain or festival traffic, and pre-test contingency plans without starting from scratch, keeping your playbook ready for curveballs.
Q: How do I train seasonal staff on a new flow without overwhelming them?
A: A short classroom briefing that explains the “why,” pocket-size map cards, and a 30-minute drive-through rehearsal before gates open are usually enough; ownership grows when staff see real-time queue stats proving the new pattern works.