
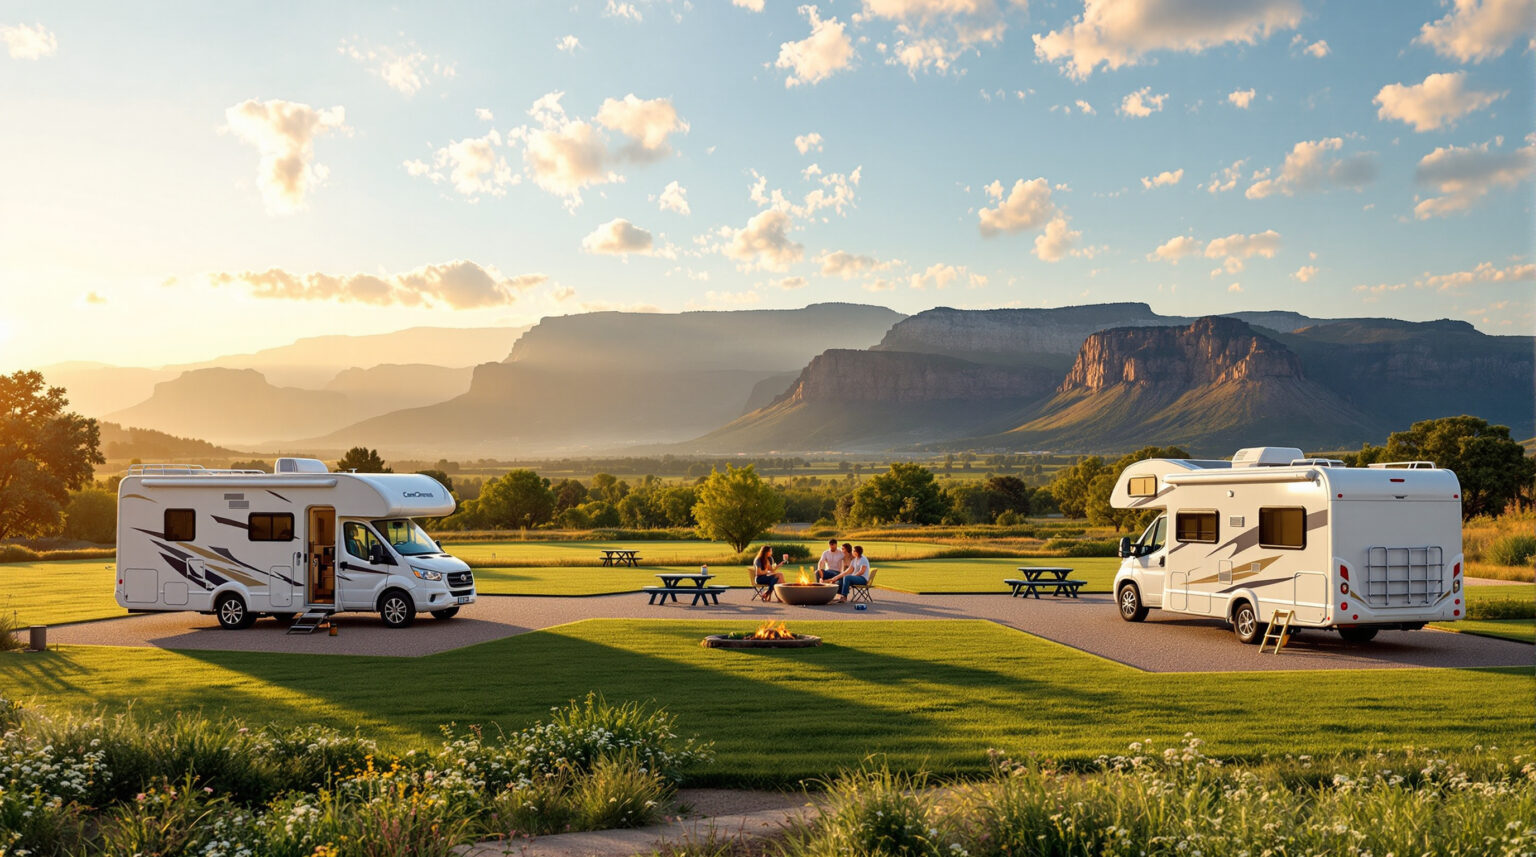
What if the only thing standing between your current rates and a 50% jump in nightly revenue is twelve miles of pavement? Habitatista’s 2025 data show that RV parks sitting within a half-hour of a marquee attraction—from the Grand Canyon to Myrtle Beach—are pocketing 25–50% more per site, every single night. Guests aren’t paying for hookups alone; they’re paying to shave minutes off the drive-time clock.
Move closer on paper and the premiums stack fast: a mere 30-minute advantage can justify a 30% rate hike, then site-type upgrades, Wi-Fi surcharges, and glamping add-ons pile even higher. In the pages ahead, you’ll learn how to badge that convenience, bundle in local experiences, and turn proximity into the simplest lever your revenue strategy has ever pulled.
Ready to stop subsidizing the park down the road? Let’s turn miles into money.
Key Takeaways
The cheat sheet below distills every tactic you’ll see in the deeper dive that follows. Skim it now, then read on to see each point put into action with numbers, tools, and timelines you can copy tomorrow.
• Parks within 30 miles or 30 minutes of a big sight can charge 25–50% more per night
• Make a map of that “Money Zone” to prove your park’s close location
• Show drive times clearly: “18 minutes to Zion” beats vague words like “near”
• Offer shuttles, e-bikes, or parking tips so guests save time, not just miles
• Raise rates by adding extras—fast Wi-Fi, fire-pit kits, guided tours—instead of giving discounts
• Track RevPAS (revenue per available site) to see if the higher prices succeed
• Partner with nearby attractions for “Stay & Play” bundles that boost bookings
• Update prices often with local events and seasons to capture peak demand
• Follow a 90-day plan: map, market, add transport, test a 20% price bump, then expand if bookings stay strong.
Keep this list handy; the sections ahead break down each takeaway with step-by-step guidance and real-world benchmarks so you can move from idea to implementation without guessing.
The Numbers That Prove Distance Equals Dollars
Habitatista’s nationwide study pinpoints a sweet spot—a 30-mile or 30-minute radius—where nightly rates leap by 25–50% compared with properties outside that zone (Habitatista data). Put that uplift against a $60 full-hookup baseline and the tariff rises to $90 without touching your power pedestal or sewer line. Luxury slips that already flirt with $150 can crest $200, nudging your park into boutique-hotel territory.
Stacking continues when you slide guests up the site ladder. Harvest Hosts’ 2025 snapshot prices dry camping at $0–20, electric-and-water pads at $30–55, full hookups at $55–90, and resort-level berths at $90–150+ (Harvest Hosts pricing). Apply a 30% proximity multiplier to each rung and your value proposition stays crystal clear—pay more, stay closer, upgrade comfort.
Map Your Profit Radius in 15 Minutes
Open Google My Maps, drop a pin on your office, and draw a 30-mile ring. Next, switch to “Add driving time” and paint a 30-minute polygon. The overlap is your Money Zone. Inside it, flag every demand driver: national park gates, marinas, ski lifts, amphitheaters, even the farmers’ market that clogs town every Saturday. This visual becomes the core slide you’ll use to justify premiums to guests and stakeholders alike.
Seasonality matters, too. A summer-only waterpark and a year-round cavern tour both sit within that radius, yet each adds revenue at different times. Color-code the icons to forecast shoulder-season holes, then plan packages that push traffic when the headline attraction sleeps. The more granular your map gets, the clearer your pricing story sounds.
Turn Minutes Into Marketing Gold
Guests process time faster than distance, so tattoo a drive-time badge—“18 minutes to Zion”—on every channel, from website hero images to OTA bullet points. Search behavior backs it up; keywords like “campground near Zion 20 minutes” convert higher than generic “Utah RV park.” Swap vague phrases for clock-specific language, and watch click-through rates climb.
An interactive map embedded on your booking page cements the message. Highlight one-tank day trips, foodie detours, and selfie-worthy pull-offs. Then ask departing guests, “Which spots did you visit?” Curate their answers into a rotating review carousel that drips social proof of convenience. Even on-site, countdown signage—“Grand Canyon South Rim, 28 miles that way”—reminds campers they made the smart decision, priming them for repeat stays.
Solve the Last Mile Before It Hurts Your Rates
Proximity premiums evaporate when guests spend vacation minutes hunting parking. Offer a twice-daily shuttle timed to attraction open and close, and those empty weekday sites suddenly fill. Shared rides often cost less than the revenue lost to one vacant premium pad.
Layer mobility choices: rentable e-bikes, golf carts, even flat-rate ride-share vouchers. A quick-tap concierge widget that secures park passes and timed-entry tickets removes friction while capturing ancillary margin. Hand guests printed turn-by-turn sheets at check-in; cell bars vanish faster than stargazing light pollution near many natural wonders. Eliminate anxiety, and willingness to pay stays high.
Layer Amenities, Not Discounts
Start with the baseline proximity uplift—say 30%. Now fold in the Harvest Hosts site ladder. A $40 electric-and-water site becomes $52 with the distance factor, $65 after adding blazing Wi-Fi, and $75 once you bolt on a private fire-pit rental and wood bundle. Guests see a transparent spectrum of comfort and convenience, not arbitrary fees.
Glamping operators push ceilings further. The Glamping Show Americas 2025 reported ADR at $251 and climbing, crediting locations beside lakes, state parks, and urban cultural hubs (Glamping ADR report). Curated sundown yoga or guided night-sky walks tap the same experiential vein for RV guests, letting you charge boutique-hotel prices without pouring concrete for new pads.
Price Dynamically, Prove It With RevPAS
Flat markups miss surges. Feed occupancy and local-event calendars into dynamic pricing software—or commit to a weekly manual review—and rates auto-adjust before comps do. Minimum-stay rules around festival weekends stabilize inventory; midweek relaxations scoop transient traffic.
Track RevPAS (revenue per available site) rather than ADR alone. If proximity and amenity stacking work, RevPAS outpaces both regional benchmarks and your own historicals. Micro-segment inventory—riverfront pull-throughs, shaded back-ins near the playground—then A/B test a 10% differential on half the cohort. When booking velocity holds steady, roll the change park-wide. Data beats gut in every season.
Partnerships That Make Premiums Stick
Negotiate wholesale attraction tickets and bundle them into “Stay & Play” packages. Guests appreciate one-click planning, and your park books incremental margin before they even arrive. Mid-week adventure deals—two nights plus kayak rental—shift demand out of crush periods while reinforcing your basecamp narrative.
Cross-promote via email swaps or synchronized social calendars with local guides, museums, or breweries. A single post about the new trail opening funnels eyeballs to both businesses. Take it offline, too: host a Friday-evening info booth where the zoo or rafting outfitter answers questions on-site. Face-to-face interaction drives same-day ticket sales and cements the perception that your park owns the inside track to the area’s must-see spots.
Your 90-Day Sprint From Map to Money
Weeks 1–2 center on groundwork: map the 30-mile ring, audit current rates, and itemize every amenity you can stack for immediate uplift. Produce the drive-time badge graphics that will headline your marketing, and identify shuttle or rental partners willing to commit to pilot schedules. Weeks 3–4 shift to digital polish—refresh your website and OTAs with time-based SEO phrases, embed the interactive map, and script post-stay review prompts that spotlight convenience and proximity.
Month 2 moves from planning to execution. Finalize shuttle or e-bike timetables, deploy the concierge ticketing widget, and spin up RevPAS tracking dashboards so data flows in real time. Month 3 caps the sprint with a limited-batch “stay-and-play” bundle plus a controlled 20% rate lift on a slice of full-hookup inventory. Monitor pickup speed; if bookings stay strong and reviews remain positive, roll the new pricing and packages across the rest of the park while iterating on what worked best.
Metrics That Keep Premiums Honest
Benchmark occupancy against peers more than 30 miles away; proximity should deliver a consistent edge. Monitor premium capture rate—the percentage your ADR outperforms the regional average—and intervene if it slips. Mine reviews for words like “close,” “easy,” and “minutes,” evidence your messaging lands.
Track ancillary spend per occupied site, too. Shuttle tickets, yoga sessions, and fire-pit rentals forecast whether on-site experiences are resonating. When numbers flatten, refresh events or rotate amenity bundles before discounting rates.
Minutes already separate you from the park across town—don’t let outdated marketing separate you from their margins too. Insider Perks will badge your drive-time advantage on every channel, feed AI-powered pricing rules that rise with demand, and automate the upsells that keep shuttles, bikes, and fire-pits booked solid. Ready to turn proximity into perpetual premium? Schedule a quick strategy session with our outdoor-hospitality team and watch the extra dollars arrive faster than your guests can reach the main attraction.
Frequently Asked Questions
Q: How do I determine whether my park is close enough to an attraction to justify a proximity premium?
A: Drop a pin on your park in Google My Maps, draw both a 30-mile radius and a 30-minute drive-time polygon, then inventory every demand driver inside the overlap; if at least one marquee attraction falls within that zone and your competitors outside it charge less, you have clear data to support a rate increase.
Q: What if several other parks share the same proximity—won’t that erase my pricing advantage?
A: Shared geography simply means you must layer differentiators like shuttle service, bundled tickets, and upgraded site types on top of the location story, letting you move beyond a commodity rate comparison and position your park as the most convenient, friction-free basecamp in the cluster.
Q: Will raising prices around peak attractions hurt my occupancy during shoulder seasons?
A: No, provided you deploy dynamic pricing that flexes rates downward when demand softens while promoting mid-week packages, events, or add-ons that keep your RevPAS healthy without relying on blanket discounts.
Q: How do I communicate a 20–30% rate increase to loyal repeat guests without backlash?
A: Frame the new pricing around time savings and added value—highlight updated drive-time badges, any bundled experiences, and convenience services you’ve layered in—then offer returning guests first access to high-demand dates rather than a blanket discount, reinforcing that they are gaining benefits, not just paying more.
Q: Are there affordable software tools that handle dynamic pricing for small or independent parks?
A: Yes, several campground-specific revenue-management platforms integrate with popular PMS systems and can automate price adjustments based on occupancy, local events, and competitor rates for as little as a few dollars per site per month, often delivering ROI within the first busy weekend.
Q: What is the easiest way to launch a shuttle without buying a bus?
A: Start with a scheduled partnership: contract a local van service or ride-share fleet for fixed departure times aligned with attraction hours, brand the pickup spot with your logo, and build the cost into a small per-seat fee or an all-inclusive stay-and-play package.
Q: Do I need special permitting to rent e-bikes or golf carts for last-mile solutions?
A: Most jurisdictions require a simple vendor permit or business license amendment—check local DOT or parks departments—so vet insurance coverage, secure liability waivers at check-in, and keep speed limits and designated paths clearly posted to stay compliant.
Q: How can I bundle attraction tickets when the venue already sells direct to consumers online?
A: Negotiate a wholesale or reseller agreement that lets you purchase tickets at a modest discount, then package them with a site reservation at face value or slightly below; guests perceive added convenience while you capture incremental margin and strengthen cross-promotion with the attraction.
Q: What metrics should I watch to confirm the premium is working?
A: Track RevPAS weekly, compare your ADR against regional comps beyond the 30-mile mark, and scrape guest reviews for words like “close,” “minutes,” or “easy”; rising ancillary revenue from shuttles or rentals further signals that your proximity message is resonating.
Q: How long does it typically take to see ROI after implementing the 30% proximity uplift and add-ons?
A: Operators who follow the 90-day sprint outlined in the article often recoup marketing and shuttle setup costs within one high-traffic season, with sustained RevPAS gains appearing on financial statements as early as the second month of peak occupancy.
Q: Can glamping operators use the same proximity strategy even though their ADR is already higher than RV sites?
A: Absolutely—glamping ADR has more headroom because guests expect hotel-level convenience, so highlighting a 10- to 20-minute drive to a marquee attraction, then layering curated experiences like guided hikes or sunset yoga, lets you push rates well beyond the average campsite multiplier.
Q: How do I integrate drive-time badges and interactive maps into OTA listings that limit custom HTML?
A: Most OTAs allow image uploads and concise text blocks, so embed the “18 Minutes to Zion” badge in your primary gallery photo, repeat the time-based phrase in the headline, and link to a mobile-friendly landing page with the interactive map in the property description to keep the convenience story front and center across every channel.