
Route Intelligence · Included in CampVantage Premium

Your booking engine keeps a zip code. It never sees the hours on the interstate, the fuel or the traffic out of the city. Route Intelligence maps the real drive behind your guests, so you can see which markets fill your sites and where a rate increase barely moves the cost of the trip.
Keeps the reservation, the dates and a zip code. Not one mile of the drive behind it.
Your analytics
Knows a visitor came from a city. Not the highway they took, the hours it took, or what the fuel cost.
Your front desk
of the typical booked guest’s trip is fuel — spent before they reach your gate, and on none of your reports.
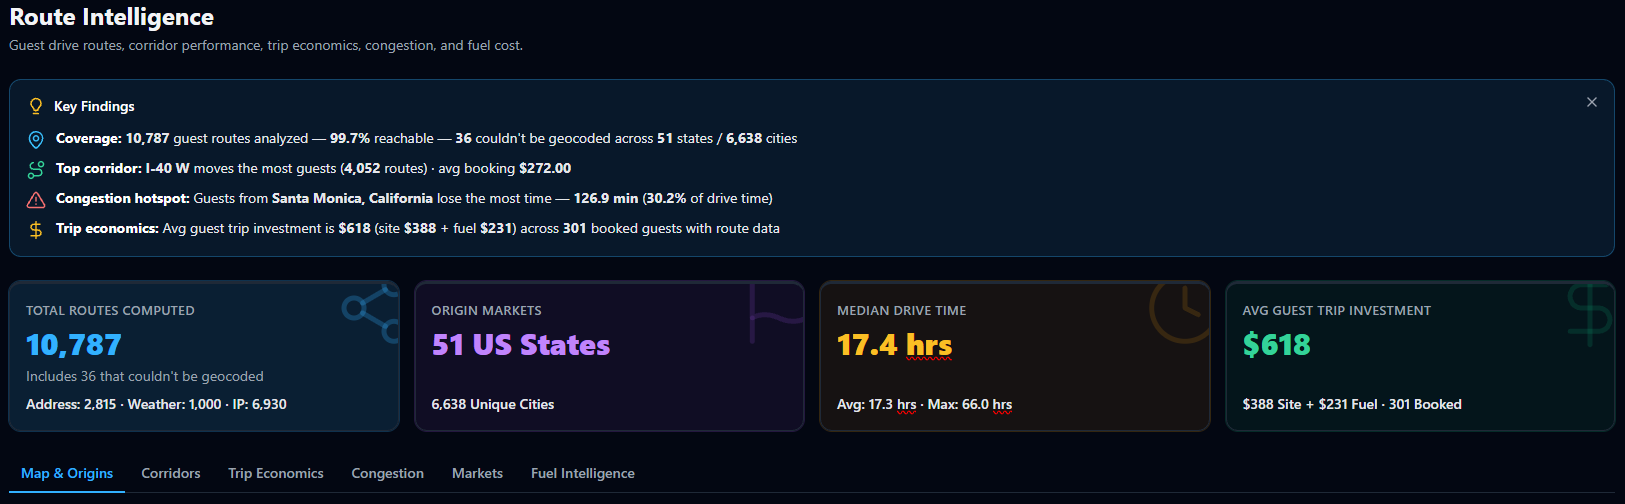
Route Intelligence takes the guests who shop and book with you and maps the drive from where they live to your gate on real roads: the highway, the hours, the miles, the traffic and the gallons of fuel, there and back.
It prices that fuel and sets it beside what the guest paid for the site, so you see the whole cost of the trip, not just your share of it. Then it rolls every drive up into distance bands, states, markets and the highways your guests use.
These aren’t survey answers or estimates of your audience. They’re your own shoppers and booked guests, and the road between their door and yours.
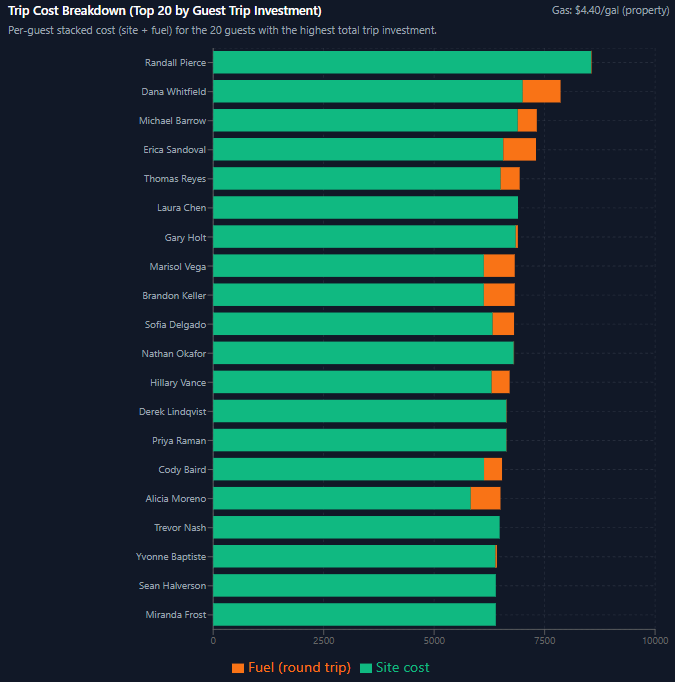
What a $10-a-night increase adds to the whole trip for the typical guest who drove more than 300 miles.
What the same $10 adds for the typical guest who lives under 100 miles away.
Average share of the trip spent on fuel, round trip, among booked guests.
The farther a guest drives, the bigger the fuel bill, and the smaller your nightly rate becomes as a share of the trip. For a local guest, your rate is most of what the trip costs. A guest who drove more than 300 miles has typically spent more on fuel than the site will cost.
Route Intelligence splits your booked guests by the drive — measured on real roads with traffic, not as a straight line on a map — so you can see who your rate matters to most, instead of pricing every site for the most price-sensitive guest in the park.
It's part of CampVantage Premium. Our team sets it up during onboarding.
As guests shop and book, each one is routed from where they live to your gate: highway, hours, miles, traffic and fuel.
Routes roll up into distance bands, states, markets and the highways that carry your guests, next to what each group booked.
The page opens on what matters most, then lets you drill into any market, highway or booked guest.
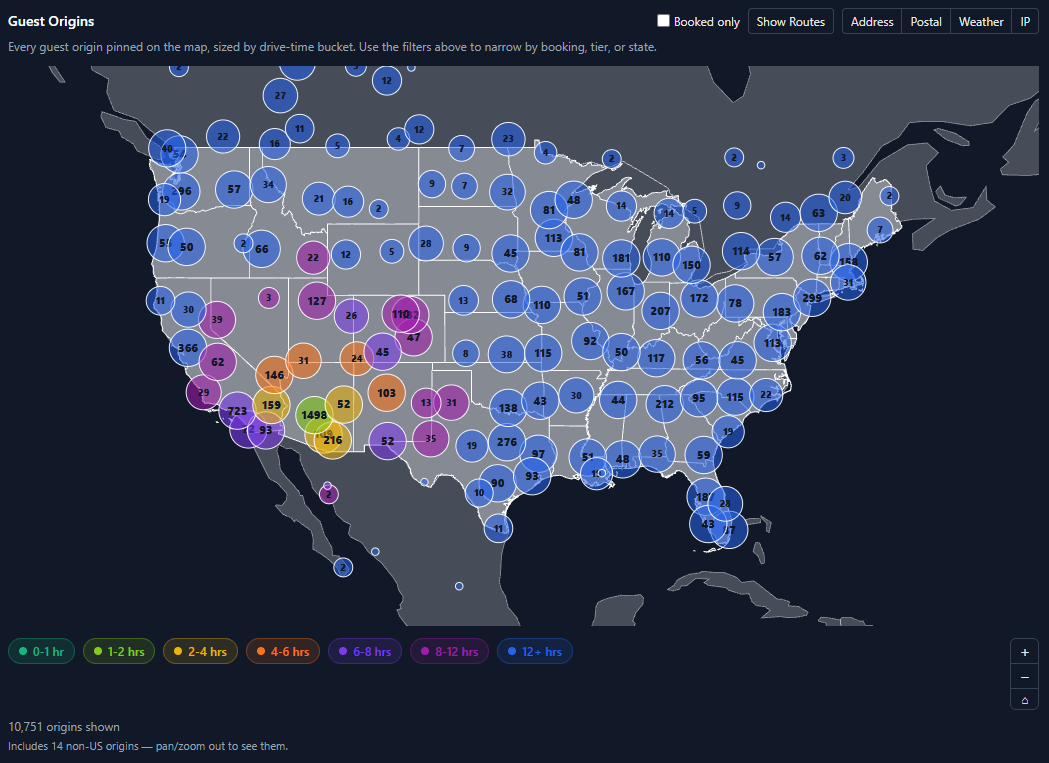
Guest Origins. Every origin pinned on a map and coloured by drive time, with a switch to show only the guests who booked. You can finally answer where your booked guests actually live — and stop paying to advertise where they don’t.
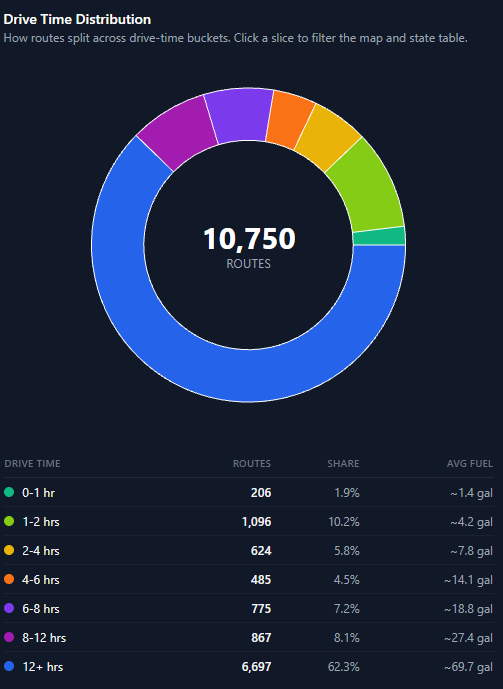
Drive Time Distribution. Your guests split into bands from under an hour to more than twelve. It tells you whether you’re a weekend-drive park or a destination, and how wide your ad radius should really be.
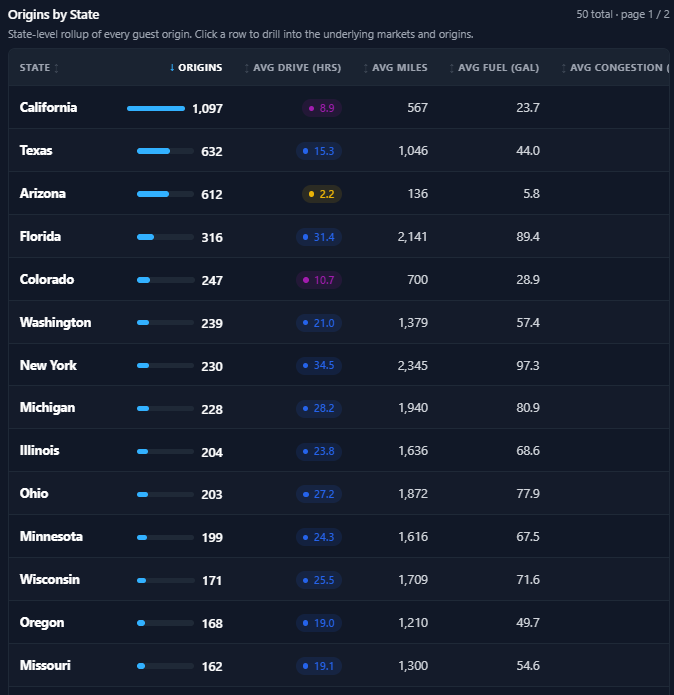
Origins by State. Every state ranked by guests, average drive, fuel and traffic, drilling down to the city. It settles which regional RV shows and state campaigns are worth the money.
Hotels get flights and a booking window. Campgrounds get rigs, towed cars and whole days on the interstate — and no other software in your office measures any of it. Route Intelligence puts the drive next to the site type each guest booked, so the trip and the stay finally sit on one chart.
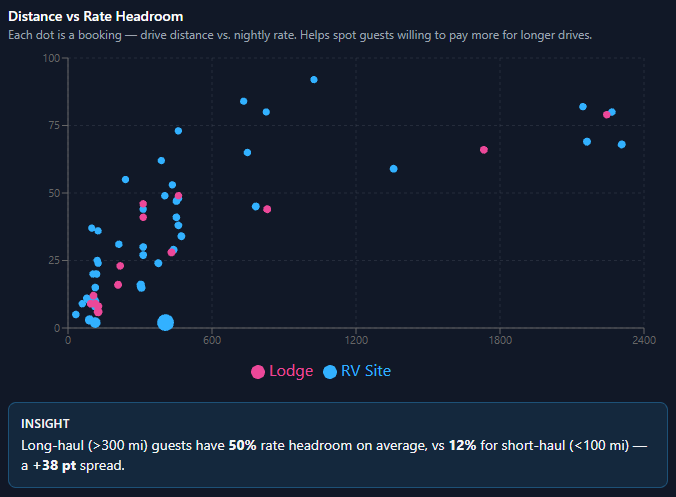
Each booking plotted by how far the guest drove against how much of their trip went to fuel. The further right a guest sits, the less your nightly rate weighs on them — so you can see where a premium rate lands softly and where it doesn’t.
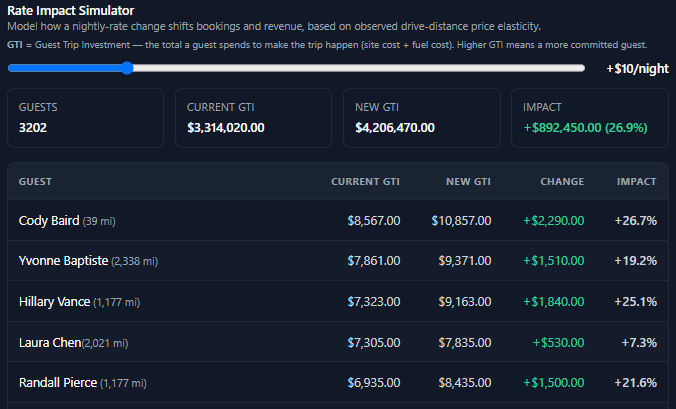
Slide a nightly increase and see what it adds to each booked guest’s whole trip, guest by guest — on real stays, before the rate goes live.
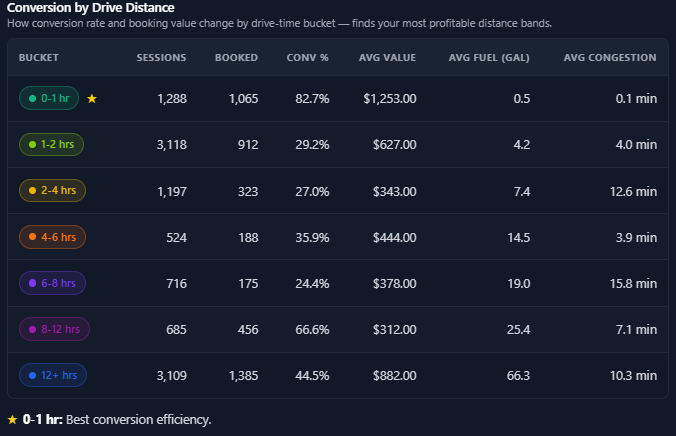
Shoppers, bookings, conversion and average booking value for each drive-time band. It shows which distances book and which only browse, so ad budget follows the guests who convert.
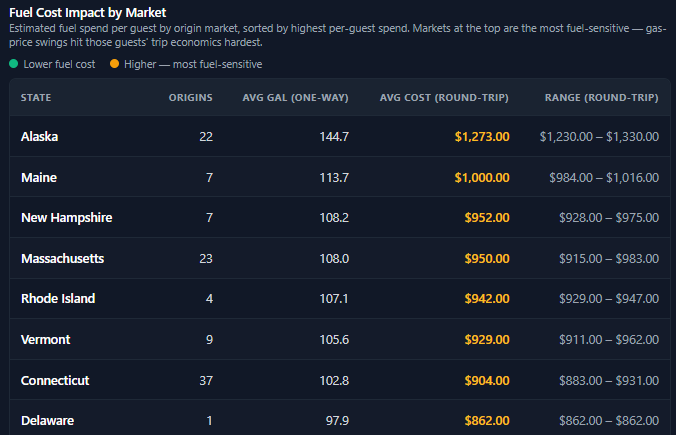
Round-trip fuel per guest for every origin state. When gas prices jump, you know which markets feel it first and where to soften the message.
Every guest’s route is labelled by the highway that carries it. Route Intelligence ranks those corridors by how many shoppers travel them and what the ones who book spend, so billboards, radio and geo-targeted ads go where the bookings come from — not just the traffic.
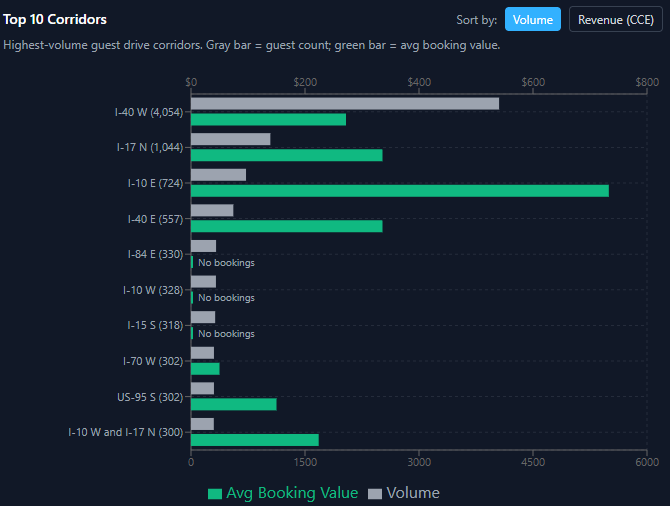
Top corridors, sortable by volume or by the revenue they bring, with guest count beside average booking value.
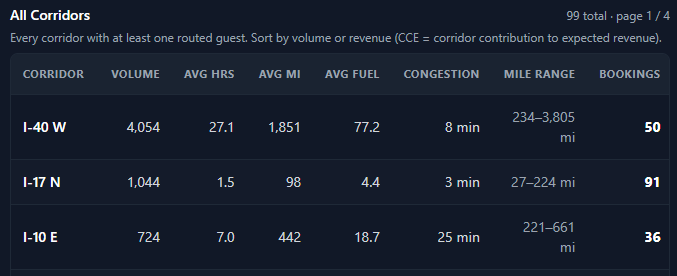
Every corridor with drive time, miles, fuel, traffic, bookings, average value and conversion — the whole list, not just the leaders.
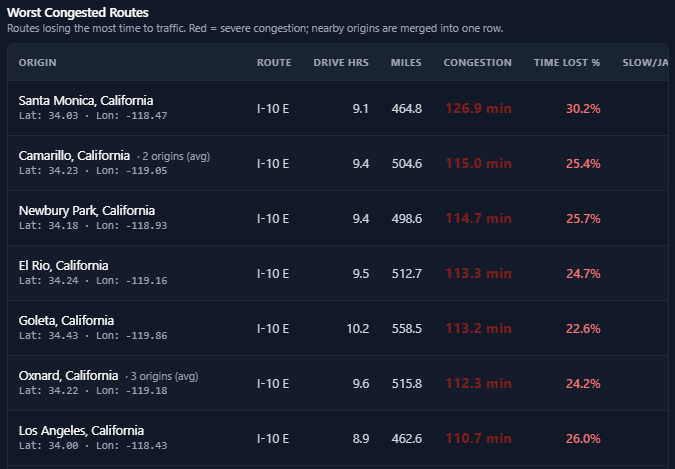
The approaches that lose the most time to traffic, with the share of the drive lost. It tells you which markets to sell a midweek or early arrival to.
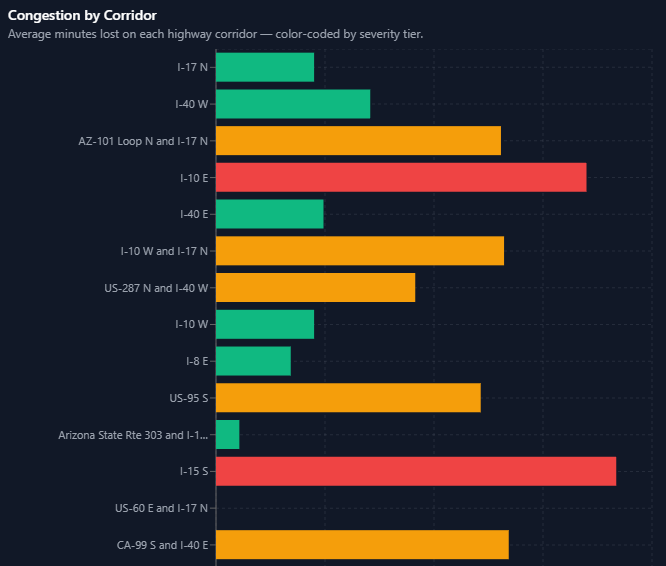
Average minutes lost to traffic on each corridor, coloured by severity.
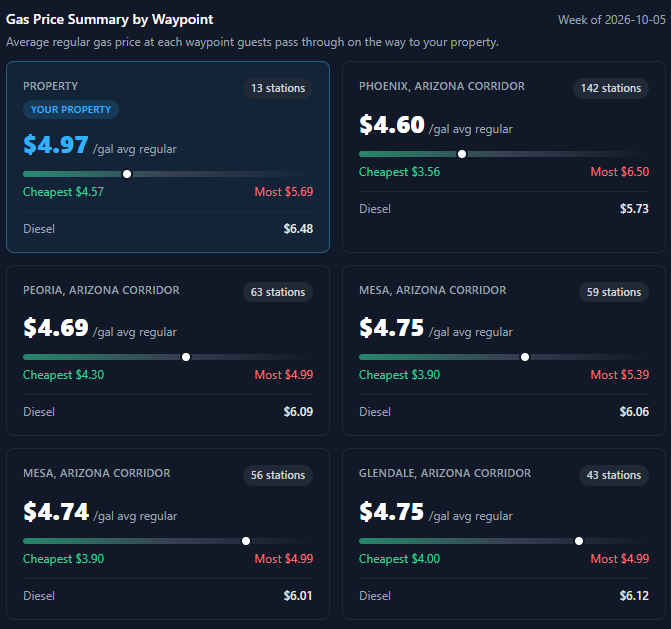
Regular and diesel at your property and in the towns your guests pass through. It tells you whether to tell arriving guests to fill up before the last stretch or after it.
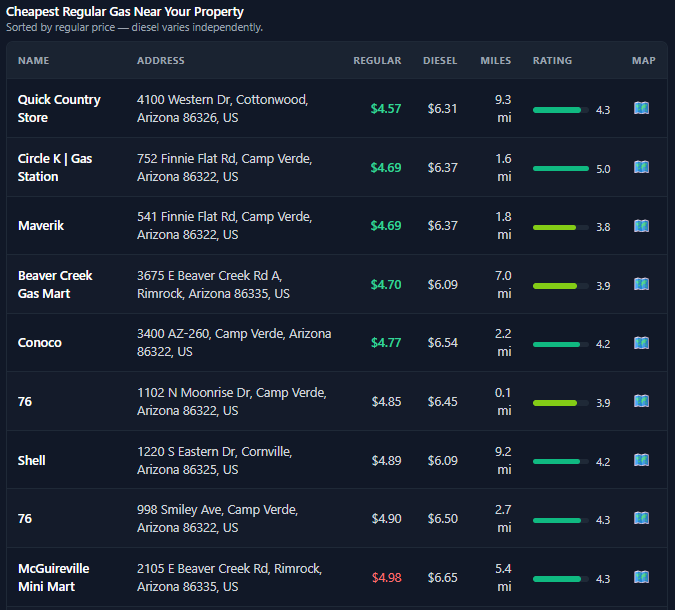
Stations near your gate sorted by price, with diesel, distance, rating and a map link — so your front desk can point arriving rigs to a better fill-up than the one on the highway.
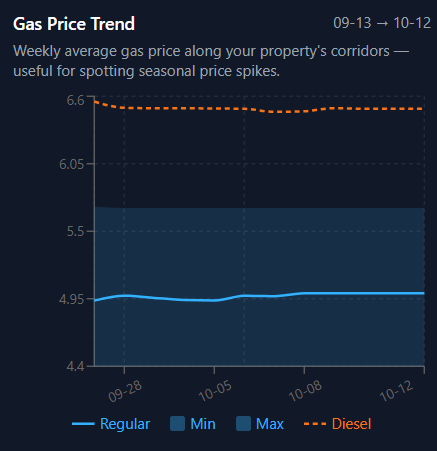
Weekly average prices on the roads to your park, so a price spike on your guests’ route is something you see, not something you hear about.
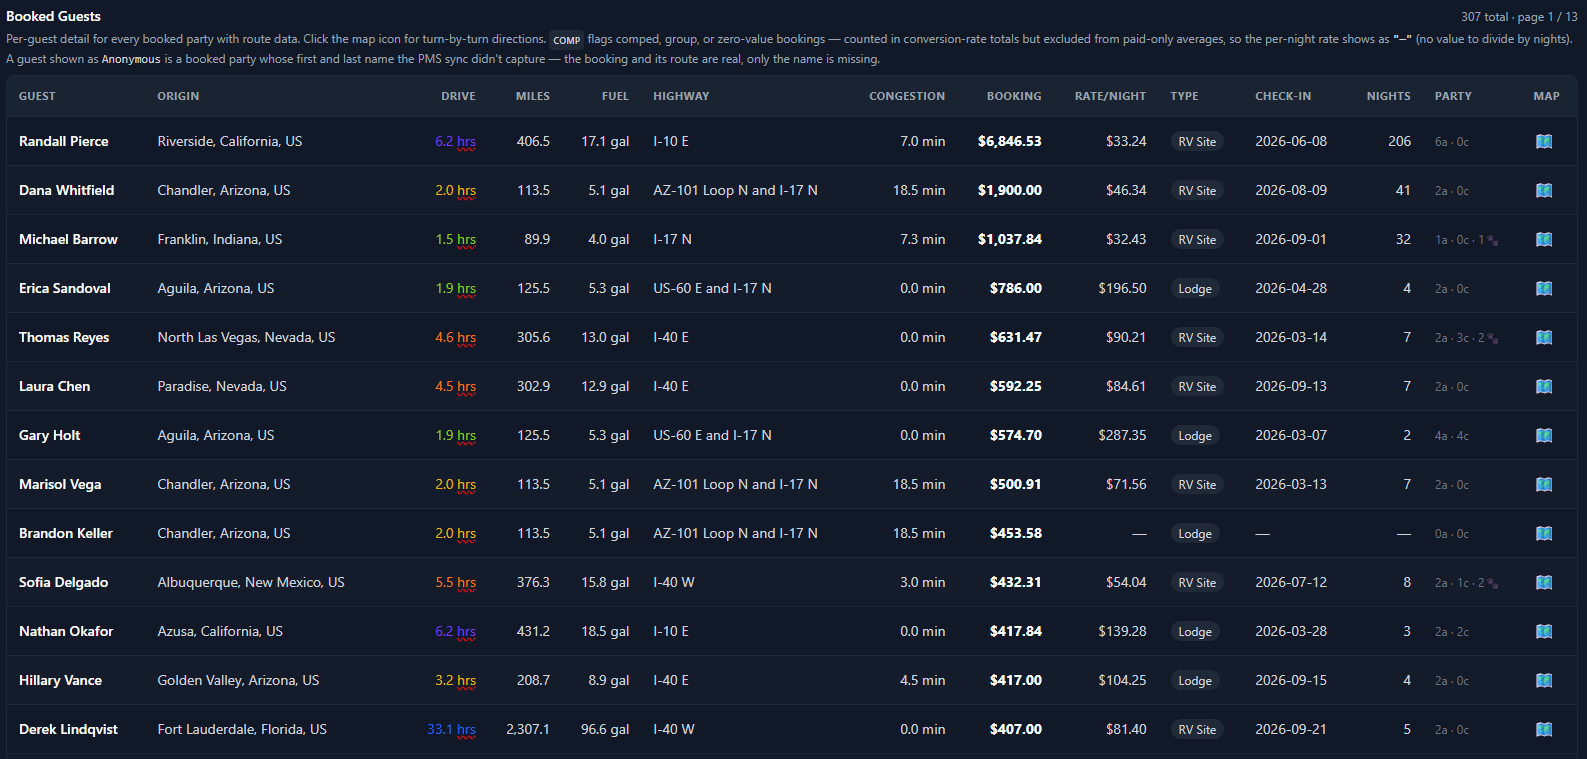
Not a summary. One row per booked party: where they drove from, the hours, miles, fuel, highway and traffic, beside what they booked, the rate per night and the site type. Any row opens turn-by-turn directions from where the guest set out to your gate.
Included in the membership. No separate charge, no per-use fee, no revenue share.
Everything in CampVantage Growth, plus:
The call takes 15 minutes. We look at your park, not a slide deck.
It’s built to run alongside the booking engine you already have — no switching platforms, no changes to your checkout, nothing different for your guests. We confirm your booking engine on the strategy call, and our team handles setup during onboarding.
No. Our team handles the entire setup on your website. There is nothing for you or your reservation provider to build.
The median property recovers its first booking 2.4 hours after switching it on. Data starts collecting as soon as setup is finished.

Route Intelligence is part of CampVantage Premium. Book a call and we’ll walk you through it.